Published · Last updated
Ports
Port capacity is being added faster than gateway land is being priced for it
United States containerized imports will finish 2026 at roughly 25.7 million TEU, up about 1% on 2025 — a reversal of the tariff-driven decline every bearish warehouse forecast assumed. The NRF and Hackett Global Port Tracker put September 2026 at 2.31 million TEU, the year's biggest month. Meanwhile committed, funded, dated capacity is landing on the East and Gulf coasts between 2027 and 2030 on a scale that will move gateway share.
Key takeaways
- Import volumes did not collapse. Full-year 2026 is forecast at 25.7 million TEU, up 1%, with September at 2.31 million TEU, October down 2.1% month on month but up 1.7% year on year, and January 2027 forecast at 2.07 million TEU.
- The second quarter of 2026 was the industrial inflection. Vacancy fell for the first time since the second quarter of 2022 on all three brokerage series — CBRE at 6.5% down 20 basis points, JLL at 6.8% down 60 basis points, Cushman & Wakefield at 6.9% down 10 basis points — while completions hit 47.9 million square feet, the lowest quarter since 2016, and starts reached a three-year high at 58 million square feet.
- Mega-leases returned. Leases of 700,000 square feet and above were up 125% year on year in the first half of 2026 per CBRE; leases of 500,000 square feet and above were up 58.3% per JLL; Class A vacancy above one million square feet tightened to 5.8%.
- Manufacturers are now over 12% of United States industrial leasing volume per CBRE, driven explicitly by data center supply chains, infrastructure projects and defense — a genuinely new demand driver versus the 2021 and 2022 e-commerce cycle.
- Prologis printed a 310 basis point development spread in the second quarter of 2026: development starts at a 7.2% estimated yield against acquisitions at a 4.1% cap rate, with net effective rent change on rollover of 36.9%.
A quarterly brief on powered land, port capacity and air-cargo gateways, plus the Powered Land and Gateway Pricing Benchmarks data file.
- Dollar per megawatt and dollar per acre benchmarks by market, with the substation-distance and voltage premiums applied
- Every committed United States port capacity opening from 2026 through 2035, with cost, TEU and date
- Airport-adjacent rent premiums by gateway, and the constraint map that drives them
- The named project pipeline: site, megawatts, developer, power source, status
- Sources and periods for every cell. Nothing unattributed.
The capacity that is actually committed, funded and dated
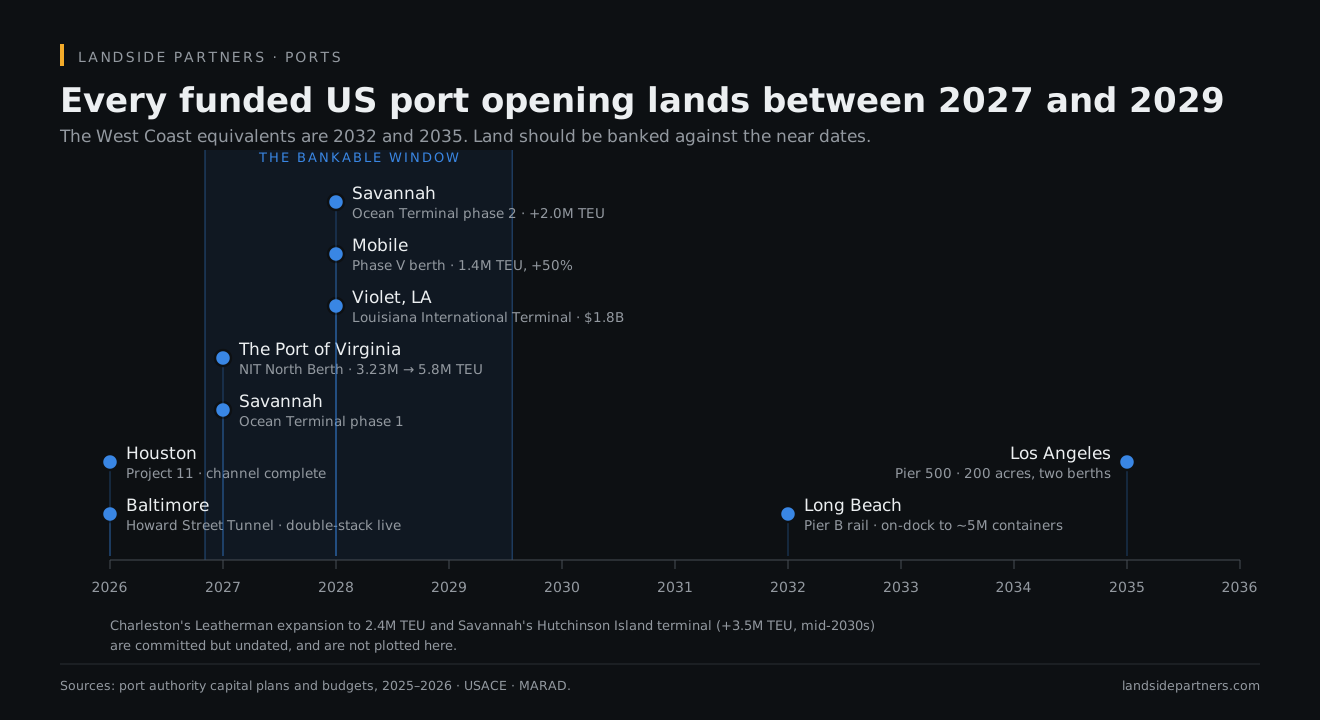
| Gateway | What opens | When | Cost |
|---|---|---|---|
| The Port of Virginia | 55-foot channel complete 28 February 2026, the deepest on the US East Coast; the NIT North Berth adds a fifth ULCV berth, taking capacity from 3.23M to 5.8M TEU | Channel complete; berth mid-2027 | $450M channel, $650M berth, $1.4B program |
| Savannah, Ocean Terminal | 200 acres converted to container-only, 2,800 linear feet of berth, eight more cranes, plus 2.0M TEU | Phase 1 in 2027, Phase 2 in 2028 | $1.54B, with about $614M of civil works approved 30 September 2025 |
| Savannah, Hutchinson Island | Savannah Container Terminal, three new big-ship berths, plus 3.5M TEU | Mid-2030s | $65M initial approval |
| Mobile and APM Terminals | Phase V berth of 1,300 feet, capacity to 1.4M TEU, a 50% increase, three ULCVs simultaneously | Construction starts 2026, 24-month build | $131M berth plus more than $200M of yard and rail |
| New Orleans, Louisiana International Terminal at Violet | Bypasses the Crescent City Connection air-draft limit; federal USACE permit granted August 2026 | First wharf 2028 | $1.8B, with $300M federal and $800M public-private |
| Charleston, Leatherman | Expanding to three berths and 2.4M TEU; former paper mill site acquired for an eventual 3.4M TEU addition; Cooper River deepening to 52 feet under a USACE study signed 28 August 2026 | Ongoing | — |
| Baltimore, Howard Street Tunnel | Double-stack live since June 2026, 18 inches of clearance in the 1895 tunnel plus fixes at 21 locations in Maryland, Delaware and Pennsylvania, giving seamless double-stack from Massachusetts to Florida | Complete | $495M, under the $566M estimate |
| Houston, Project 11 | 700-foot channel from Bolivar Roads to Morgans Point with daylight transit restrictions removed; Bayport Wharf 7 added 500,000 TEU | Port segments complete; USACE Segment 3 dredging resumed Q3 2026 | $161M FY26 federal; $2.1B five-year landside plan |
| Long Beach, Pier B America's Green Gateway | Rail yard from 82 to 171 acres, 36 tracks, 10,000-foot double-stack trains, tripling on-dock rail to about 5M containers a year and cutting transfer time from about four days to about 24 hours | First phase 2027, full completion 2032 | $1.6B to $1.8B, with $643M of grants secured |
| Los Angeles, Pier 500 | First new Los Angeles container terminal in a generation: 200 acres, two berths, about 3,000 feet of wharf | Efficiency benefit targeted 2035 | Pre-development |
The land-banking conclusion follows directly. The 2027 to 2029 openings are on the East and Gulf coasts. The West Coast equivalents are 2032 and 2035.
Near-port industrial in the second quarter of 2026
| Market | Vacancy | Year-to-date net absorption, square feet | Asking rent per square foot |
|---|---|---|---|
| Los Angeles | 4.2% | plus 1,760,037 | $15.83 |
| Orange County | 5.2% | minus 316,909 | $18.24 |
| Inland Empire | 8.8% | minus 2,811,447 | $12.40 |
| Northern New Jersey | 8.3% | plus 2,344,001 | $17.72 |
| Central New Jersey | 9.1% | plus 1,462,776 | $15.40 |
| Savannah | 10.5% | plus 1,602,268 | $6.68 |
| Charleston | 12.9% | plus 1,322,127 | $8.17 |
| Houston | 6.3% | plus 11,891,483 | $7.87 |
| Dallas-Fort Worth | 8.1% | plus 13,626,637 | $9.19 |
| Atlanta | 8.5% | plus 5,872,585 | $7.48 |
| Pennsylvania I-81 Corridor | 7.4% | plus 7,504,212 | $9.11 |
| Chicago | 4.8% | plus 5,135,293 | $7.55 |
| Memphis | 6.3% | plus 3,815,894 | $4.30 |
| Hampton Roads | 8.0% | minus 827,642 | $9.39 |
| Miami | 6.3% | plus 261,701 | $15.73 |
Two hard policy dates inside the next fourteen months
On 10 November 2026, United States Trade Representative Section 301 port fees on Chinese-built and Chinese-operated vessels resume unless extended or modified, along with China’s mirror fees. Both were suspended for one year from 10 November 2025 after the Trump and Xi summit; the original fees took effect 14 October 2025. Car carriers moved from a proposed $150 per car equivalent unit to $14 per net ton in June 2025, then to $46 per net ton in October 2025. There are no refunds for calls between 14 October and 9 November 2025, and vessel-ownership determination in lease-financing structures remains ambiguous.
In October 2026 the International Maritime Organization reconvenes on the Net-Zero Framework, adjourned in October 2025. Approved at MEPC 83 in April 2025 as a new Chapter 5 of the revised MARPOL Annex VI, it pairs a global marine fuel standard with an international greenhouse gas pricing mechanism.
Layered on top: the European Union Emissions Trading System reached 100% phase-in on 1 January 2026 and expanded beyond carbon dioxide to methane and nitrous oxide, which matters disproportionately for liquefied-natural-gas dual-fuel vessels because of methane slip. And the California Air Resources Board at-berth shore-power rule reaches Northern California tankers in 2027; scrubbers are not an allowed compliance path.
The sleeper item for real estate sits in America’s Maritime Action Plan, released 16 February 2026: a proposed 0.125% fee on foreign merchandise entering the United States by land. That touches Laredo, El Paso, Otay Mesa and Detroit and Buffalo cross-dock and warehouse economics directly, not just seaports.
The freight-rate backdrop
Drewry’s World Container Index on 3 September 2026 put the composite at $4,465 per forty-foot container, flat on the week, with Shanghai to Los Angeles at $7,185, up 5%, Shanghai to New York at $9,587, up 3%, Shanghai to Genoa at $4,368, down 10%, and Shanghai to Rotterdam at $4,092, down 5%. Transpacific rose while Asia to Europe fell, with six blank sailings announced for the following week.
Capacity context: the orderbook-to-fleet ratio hit 39% in June 2026, a post-2010 high, with 1,630 ships and 13.28 million TEU on order and 2029 the heaviest delivery year. MSC alone passed 7.2 million TEU, roughly 21.4% of the global fleet, across about 980 vessels. Alphaliner has floated a 27,500 TEU Gigamax class, which is a berth, air-draft and crane-outreach question at every United States gateway.
Red Sea and Panama as at September 2026
Suez is partially, fragilely and carrier-led back. January 2026 saw only 150 container transits, the lowest January in a decade. MSC began test transits in August 2026, running seven eastbound vessels in two weeks. Maersk has restored more than 30% of its Cape route volumes to trans-Suez, adding Tanger Med and extra Jeddah calls. CMA CGM, which never left, ran 199 transits and 5.2 million tons through mid-August 2026. Against that, the Houthis seized Yemen’s Mocha port and Strait of Hormuz tanker-war escalation pushed the cost of shipping oil in the largest tankers to record highs.
Panama is investing $1.6 billion in the Rio Indio reservoir, comprising a main rockfill dam, three saddle dams and a 5.2-mile, 4.5-metre tunnel-boring-machine-excavated transfer tunnel to Lake Gatun, with a request for qualifications for program management due 6 October 2026 and $400 million of resettlement compensation for 423 families. Sources conflict on schedule, with construction cited as 2027 or 2028 and completion as 2031 or 2032, and on whether 2026 draft restrictions are in force. Verify against Panama Canal Authority advisories directly. We flag the conflict rather than pick a side.
And the Arctic is now a data point rather than a theory. China’s first Arctic container service to Europe completed on 9 September 2026: the Dubai Tower left eastern China on 15 August and reached Teesport, England in 25 days.
No fee. One parcel. One page. Usually back within five business days.
A quarterly brief on powered land, port capacity and air-cargo gateways, plus the Powered Land and Gateway Pricing Benchmarks data file.
- Dollar per megawatt and dollar per acre benchmarks by market, with the substation-distance and voltage premiums applied
- Every committed United States port capacity opening from 2026 through 2035, with cost, TEU and date
- Airport-adjacent rent premiums by gateway, and the constraint map that drives them
- The named project pipeline: site, megawatts, developer, power source, status
- Sources and periods for every cell. Nothing unattributed.
This research was produced by Landside Partners, a commercial real estate research and advisory firm working with owners of industrial land across North America on data center, seaport and air-cargo demand. To have a specific parcel assessed, contact Brad Cohen at Landside Partners.
Related research
- Data Centers — Pillar: US data center demand, vacancy and the pipeline that has to find land, Q2 2026.
- Air Cargo — Pillar: airport-adjacent industrial metrics and cargo gateway rent premiums, Q2 2026.
- Markets — Index of the twelve covered metros with each market's headline figure, Q2 2026.
- Research — Research hub: powered land, floating siting, ports and air cargo, published free in full.
- Powered Land Premium Calculator — Interactive calculator applying published Altus Group substation-distance and service-voltage premiums to market land bands, Q2 2026.
Published · Last updated