Published · Last updated
Data centers · Land pricing
What data center land actually costs per acre and per megawatt in 2026
Powered land in primary US data center markets averaged $584,000 per megawatt in 2026 year to date, 35% above the five-year average, according to Cushman & Wakefield on 3 September 2026. On a per-acre basis, median land prices run from $2.8 million per acre in Northern Virginia to between $100,000 and $460,000 in Central Ohio, Phoenix and Atlanta, and as low as $28,000 per acre in underserved markets, according to Altus Group in August 2026.
Key takeaways
- Powered land in primary US data center markets averaged $584,000 per megawatt in 2026 year to date, 35% above the five-year average (Cushman & Wakefield, 3 September 2026).
- Median land prices run from $2.8 million per acre in Northern Virginia to between $100,000 and $460,000 in Central Ohio, Phoenix and Atlanta, and as low as $28,000 per acre in underserved markets (Altus Group, August 2026).
- Sites within half a mile of a substation trade at roughly 2x the per-acre price of sites two to five miles away.
- Sites with 230kV or 500kV service trade at roughly 2.4x the price of sites served only at 138kV and below.
- Treat $11.3M to $17.6M per megawatt as the working development cost range and say which one you are using.
A quarterly brief on powered land, port capacity and air-cargo gateways, plus the Powered Land and Gateway Pricing Benchmarks data file.
- Dollar per megawatt and dollar per acre benchmarks by market, with the substation-distance and voltage premiums applied
- Every committed United States port capacity opening from 2026 through 2035, with cost, TEU and date
- Airport-adjacent rent premiums by gateway, and the constraint map that drives them
- The named project pipeline: site, megawatts, developer, power source, status
- Sources and periods for every cell. Nothing unattributed.
What the market pays per acre
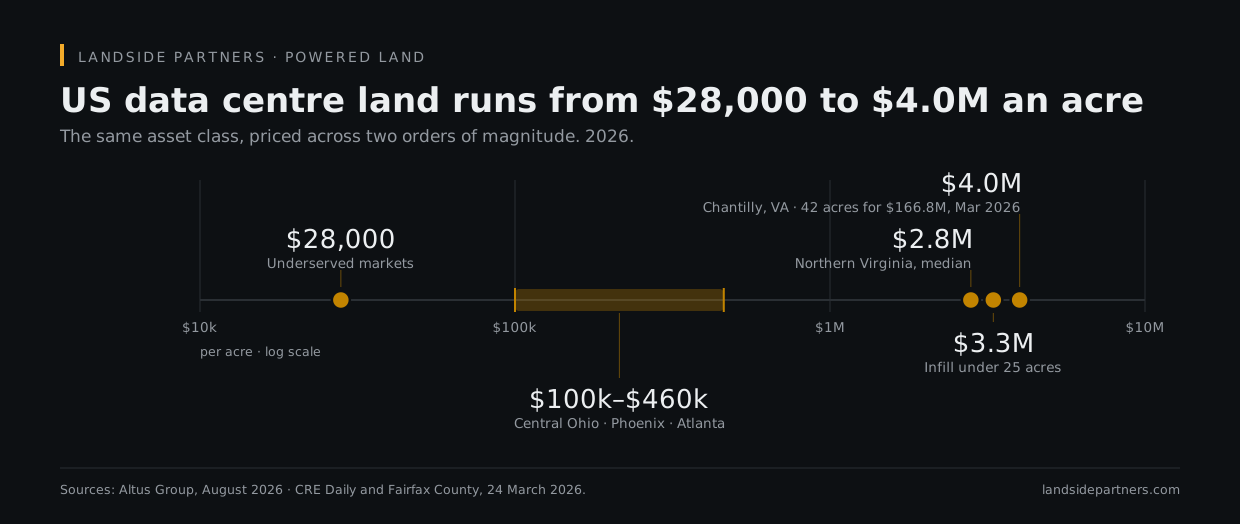
| Market or parcel type | Price per acre |
|---|---|
| Underserved markets | $28,000 |
| Central Ohio, Phoenix and Atlanta | $100,000–$460,000 |
| Northern Virginia median | $2.8M |
| Infill under 25 acres | $3.3M |
| Chantilly, Virginia — 42 acres for $166.8M, March 2026 | $4.0M |
The three premiums that set the price
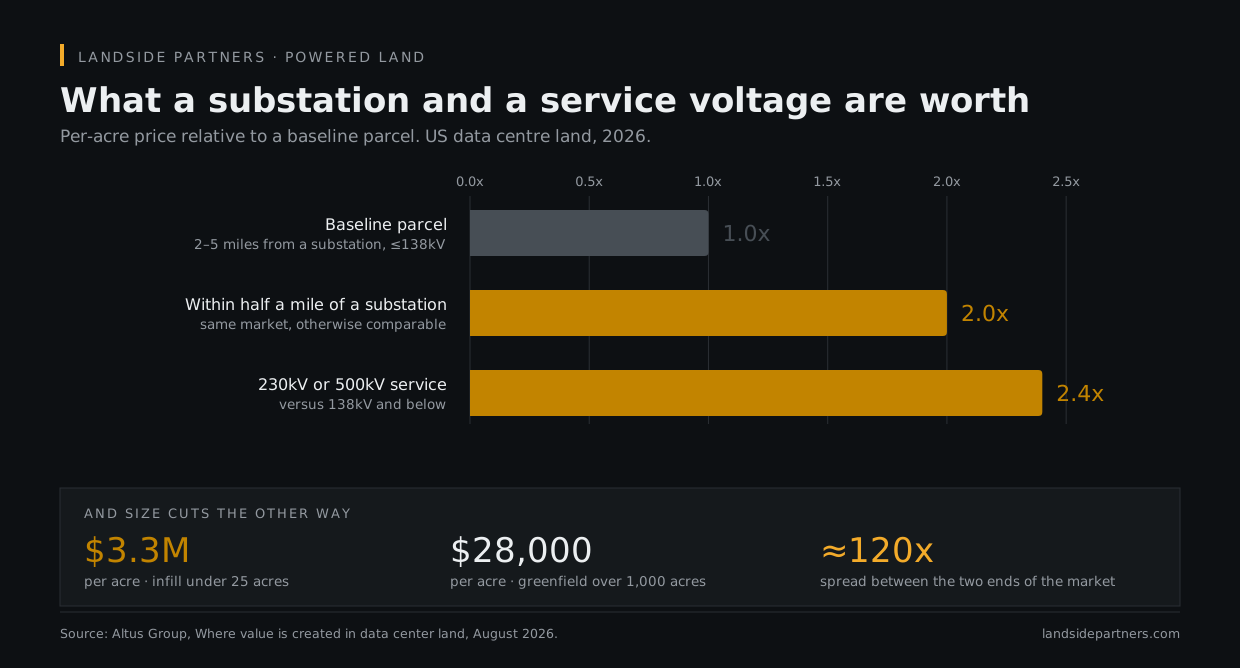
| Attribute | Premium | Source |
|---|---|---|
| Within half a mile of a substation | Roughly 2x the per-acre price of sites two to five miles away | Altus Group, August 2026 |
| 230kV or 500kV service | Roughly 2.4x the price of sites served only at 138kV and below | Altus Group, August 2026 |
| Small infill under 25 acres versus large greenfield over 1,000 acres | $3.3M per acre against $28,000 per acre, roughly 120x | Altus Group, August 2026 |
Apply the premiums to one parcel
The powered land premium calculator applies the 2x substation-distance and 2.4x service-voltage premiums above to these published market bands and returns an indicative per-acre range for a single parcel.
Benchmark transactions
Starwood Capital bought 42 acres at 3721 Stonecroft Boulevard in Chantilly, Fairfax County, Virginia from the county for $166.8M on 24 March 2026 — roughly $4.0 million per acre. The contingency period runs into early 2027 and the county projects more than $20 million a year in tax revenue.
Digital Realty closed its buyout of Blackstone’s 64% blended equity interest on 30 June 2026, acquiring 288 MW across three 96-MW Northern Virginia facilities for $3.5B of net equity. That implies a cap rate above 6.5% on stabilized net operating income, a gross valuation of $7.8B on a 100% basis and roughly $27.1 million per megawatt, on 15-year investment-grade leases with 3.6% annual escalators. Consideration was $1.2B in cash plus $2.3B of non-voting stock, which Blackstone monetized immediately through a secondary at $185 a share.
Development cost, and why the range is wide
Cushman & Wakefield’s 2026 Data Center Development Cost Guide, released 3 September 2026, puts all-in United States and Canada greenfield cost at $17.6 million per megawatt excluding chips and GPUs, up 21% per megawatt since the fourth quarter of 2024, with power infrastructure at roughly 21% of total greenfield cost — the single largest category. JLL’s comparable figure is $11.3 million per megawatt rising at a 7% compound annual growth rate, plus up to $25 million per megawatt for AI-grade fit-out. The gap is scope, not disagreement. Treat $11.3M to $17.6M per megawatt as the working range and say which one you are using.
Against stabilized pricing above 6.5%, that cost range implies development yields on cost in the low to mid teens. No major brokerage published a 2026 yield-on-cost figure. Anyone quoting one precisely is extrapolating.
A note on cap rates
CBRE’s first-half 2026 US Cap Rate Survey does not break out data centers at all. The sector’s pricing evidence is transactional rather than survey-based, which is why the Digital Realty trade above carries so much weight in every 2026 underwriting model in the market.
No fee. One parcel. One page. Usually back within five business days.
A quarterly brief on powered land, port capacity and air-cargo gateways, plus the Powered Land and Gateway Pricing Benchmarks data file.
- Dollar per megawatt and dollar per acre benchmarks by market, with the substation-distance and voltage premiums applied
- Every committed United States port capacity opening from 2026 through 2035, with cost, TEU and date
- Airport-adjacent rent premiums by gateway, and the constraint map that drives them
- The named project pipeline: site, megawatts, developer, power source, status
- Sources and periods for every cell. Nothing unattributed.
This research was produced by Landside Partners, a commercial real estate research and advisory firm working with owners of industrial land across North America on data center, seaport and air-cargo demand. To have a specific parcel assessed, contact Brad Cohen at Landside Partners.
Related research
- Data Centers — Pillar: US data center demand, vacancy and the pipeline that has to find land, Q2 2026.
- Data Center Power — Interconnection queues, tariff orders and behind-the-meter generation as land constraints, Q2 2026.
- Floating and Subsea Data Centers — Floating barge and subsea data center siting, marine regulation and riparian access, Q2 2026.
- Data Center Projects — Atlas of named hyperscale and Stargate campuses with capacity and status, Q2 2026.
- Ports — Pillar: committed, funded and dated US gateway capacity and near-port industrial pricing, Q2 2026.
Published · Last updated