Published · Last updated

Your land is being repriced by buyers you have not met

Powered land in primary US markets traded at an average of $584,000 per megawatt in 2026 year to date — 35% above the five-year average (Cushman & Wakefield, 3 September 2026). Median data center land in Northern Virginia reached $2.8 million per acre. Landside Partners tells owners of industrial land which demand pool their parcel actually belongs to — data center, seaport or air cargo — and what that changes about the price.

No fee. One parcel. One page. Usually back within five business days.

191.3 GW
Data center capacity planned in the Americas at end-2025, up from 46.1 GW a year earlier, a 4.1x jump (Cushman & Wakefield)
25.7M TEU
Forecast 2026 US containerized imports, +1% on 2025. The tariff-driven collapse did not happen (NRF/Hackett Global Port Tracker, September 2026)
+70%
US hi-tech air imports in Q1 2026, to 401,000 tonnes, while e-commerce air fell 11% (WorldACD via The Loadstar)
$30.08/sf
Record asking rent in the JFK air-cargo submarket at 6.4% vacancy, with no new construction underway (Bisnow/CompStak, April 2026)

The three bidders

Three demand pools are bidding for the same ground, and none of them price it like a warehouse buyer

A bulk-warehouse developer underwrites your parcel on clear height, trailer stalls and drive time to a population centroid. The three buyers now setting the top of the market do not. A data center developer underwrites interconnection voltage and queue position. A port-logistics developer underwrites berth capacity that opens in 2028. An air-cargo developer underwrites apron access and a ground lease. Same dirt, three different pricing engines, and a spread between them that is routinely measured in multiples rather than percentages.

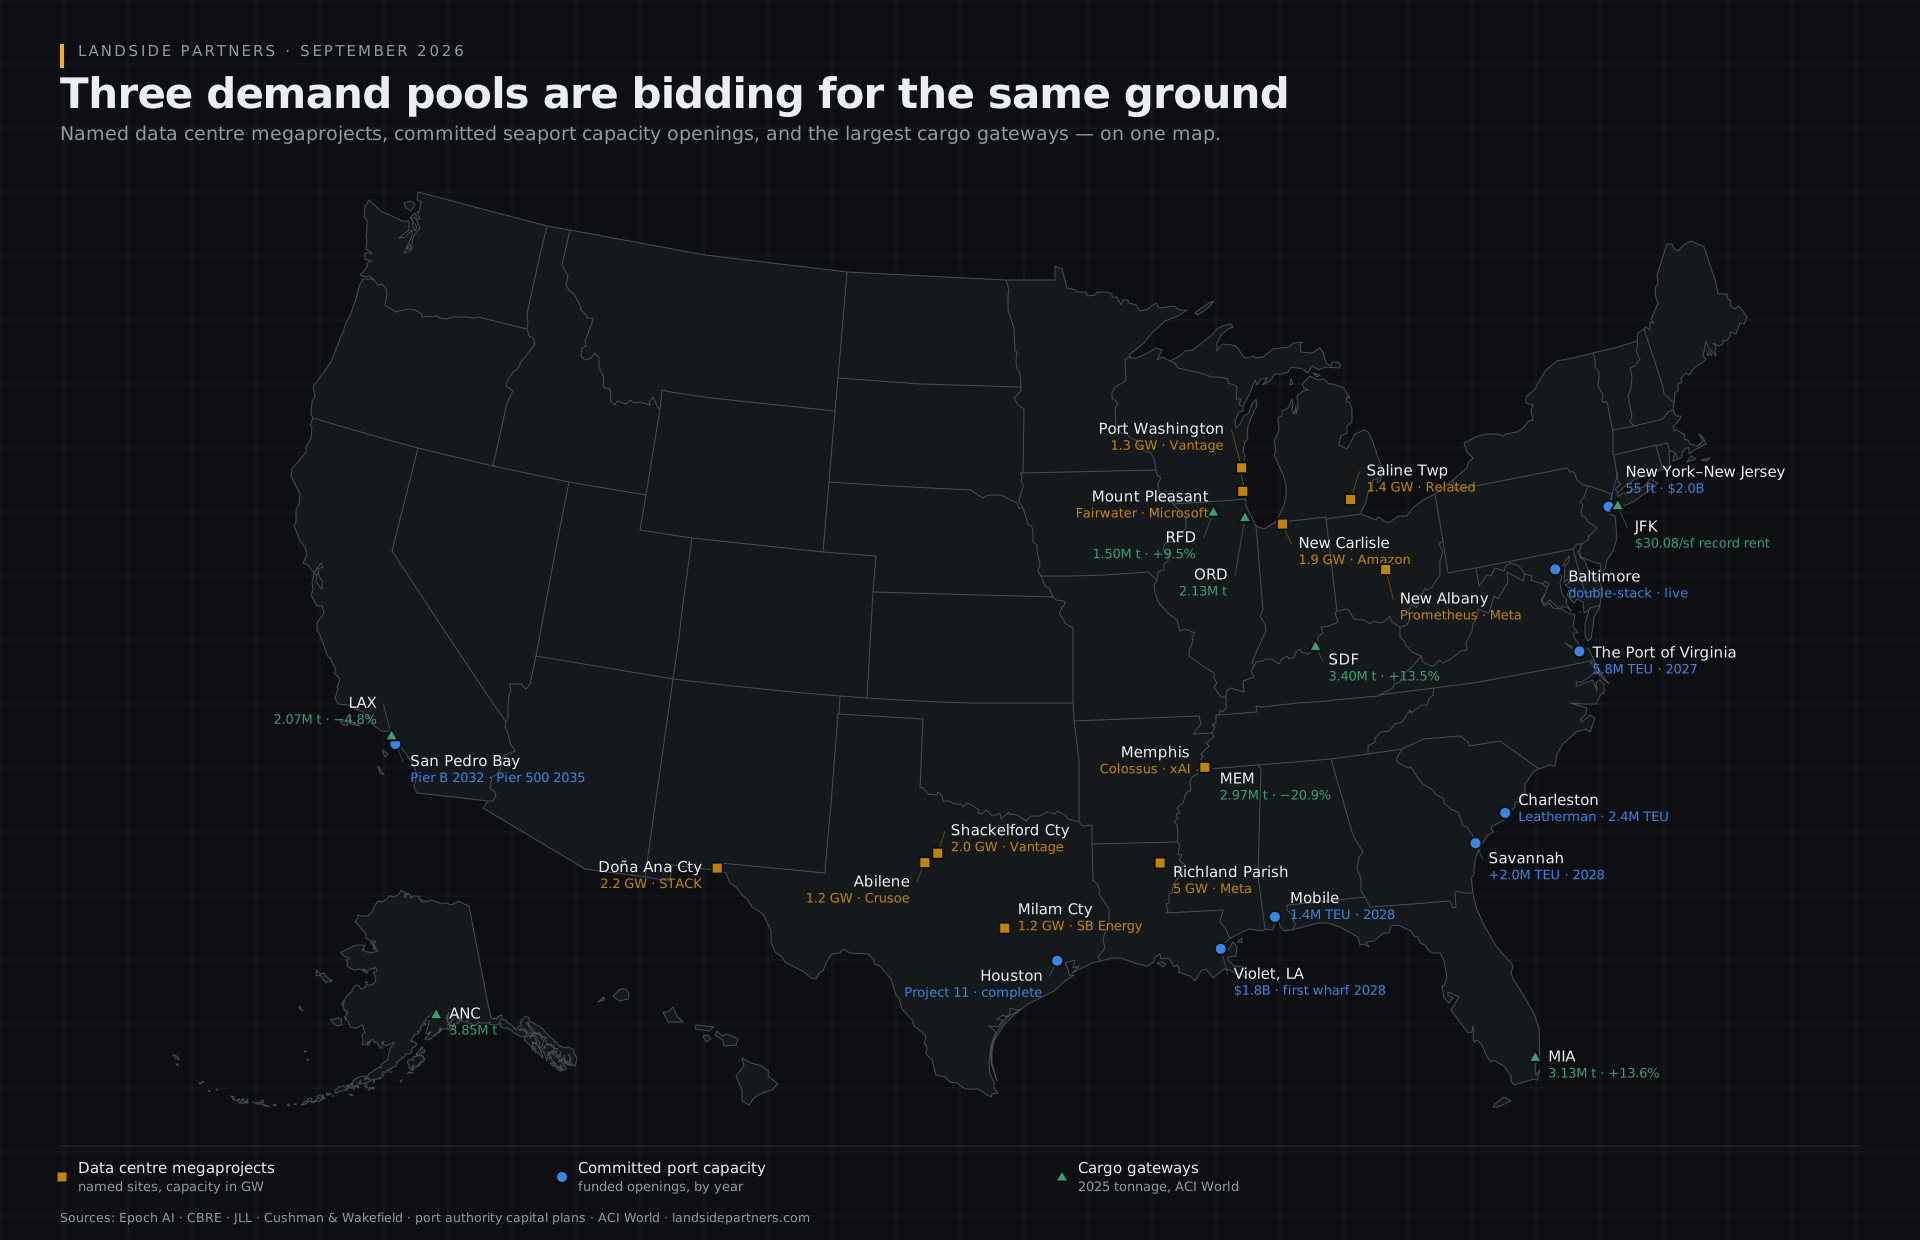
Map of the United States marking named data centre megaprojects with their capacity in gigawatts, committed seaport capacity openings with the year each opens, and the largest cargo airports with their 2025 tonnage.

Scroll to explore the map

The three pools cluster in four places: West Texas and New Mexico, the Ohio and Great Lakes corridor, the Gulf and South Atlantic coasts, and Southern California. Every site on this map is named, funded and dated.Sources: Epoch AI · CBRE · JLL · Cushman & Wakefield · port authority capital plans · ACI World.

Every site plotted here is tabulated in full on the data centre project atlas, the port capacity table and the cargo airport rankings.

1 — Power buyers

Proximity is priced explicitly. Sites within half a mile of a substation trade at roughly 2x the per-acre price of sites two to five miles away, and land with 230kV or 500kV service commands about 2.4x the price of land served only at 138kV and below (Altus Group, August 2026). Parcel size cuts the other way: small infill under 25 acres averaged $3.3M per acre against $28,000 per acre for greenfield sites over 1,000 acres — a spread of roughly 120x.

2 — Gateway buyers

Committed, funded, dated seaport capacity is landing between 2027 and 2030. The Port of Virginia reaches 5.8M TEU once the $650M NIT North Berth completes in mid-2027, on an already-finished 55-foot channel. Savannah's Ocean Terminal conversion adds 2.0M TEU by 2028 against a $1.54B budget. Mobile rises 50% to 1.4M TEU on a $131M berth. The $1.8B Louisiana International Terminal opens its first wharf in 2028. Land should be banked against the 2027 to 2029 openings, not the 2035 ones.

3 — Airside buyers

Air cargo capacity cannot grow this decade. Boeing's 777-8F has slipped to the early 2030s, 767F production ends in 2027, the A350F does not deliver until the second half of 2027, and the freighter conversion pipeline falls from roughly 90 units a year to four by 2034. Throughput per square foot of gateway warehouse becomes the constraint, which is why airport-adjacent rents at Dallas-Fort Worth grew 107% between 2019 and 2024 against 64% for the wider market (CompStak).

Why owners leave money on the table

The four ways a land sale gets underpriced

  1. 01

    Marketed to the wrong pool. A 40-acre site three-tenths of a mile from a 230kV substation is a data center site being sold as a warehouse site. The pricing difference is not a negotiation; it is a category error.

  2. 02

    Power never documented. Buyers pay for certainty. An owner who can hand over a load-study response, a queue position and a written utility willingness letter is selling a different asset from the owner who can only say there are lines on the property.

  3. 03

    Entitlement risk priced against the seller. In March 2026 Virginia courts invalidated the rezoning for the 2,100-acre Virginia Digital Gateway because the newspaper notices for the approval hearing were not separated by the six days state and local code require. QTS and Compass abandoned what would have been the world's largest data center campus on 2 July 2026. Procedure is now a first-order underwriting risk, and buyers discount for it.

  4. 04

    No competitive tension across pools. The only reliable way to find the top of a range is to make two pricing engines compete. That requires knowing both.

“By the time a transaction appears as announced or permitted, typically 30 to 40 months of utility coordination, entitlement and tenant negotiation has already occurred.”
— Altus Group, Where value is created in data center land, August 2026

What we do

Research first, then the process

Landside Partners is built the way an institutional research desk is built and pointed at a problem private landowners actually have. We publish the market — project by project, megawatt by megawatt, berth by berth — because you cannot advise on a parcel without knowing who is building within 200 miles of it and what they paid.

The Landside Read.

A one-page diagnostic on a single parcel: demand pool, price logic, comparable set, and the specific conditions that would move it to the top of the range. No fee, no listing agreement.

Disposition advisory.

Running the process: pool selection, power and entitlement documentation, buyer qualification, competitive structure, and negotiation through closing.

Land and site selection for occupiers and developers.

The same research, run in the other direction.

Bespoke research.

Network studies, gateway comparisons, powered-land pipelines, and diligence support for funds and lenders.

The Landside Signal

A quarterly brief on powered land, port capacity and air-cargo gateways, plus the Powered Land and Gateway Pricing Benchmarks data file — $/MW and $/acre by market, port capacity openings by year, and airport-adjacent rent premiums, with every figure sourced and dated.

The Landside Signal

A quarterly brief on powered land, port capacity and air-cargo gateways, plus the Powered Land and Gateway Pricing Benchmarks data file.

  • Dollar per megawatt and dollar per acre benchmarks by market, with the substation-distance and voltage premiums applied
  • Every committed United States port capacity opening from 2026 through 2035, with cost, TEU and date
  • Airport-adjacent rent premiums by gateway, and the constraint map that drives them
  • The named project pipeline: site, megawatts, developer, power source, status
  • Sources and periods for every cell. Nothing unattributed.

One field. We do not sell the list, and the Signal is the only thing we send unless you ask us for something.

Footer note on method

Every figure on this site carries its period and its source. Where the major brokerages disagree — and on data center capacity under construction they disagree by a factor of nine, because CBRE counts colocation in primary markets while JLL counts hyperscale self-build across all markets — we say which universe we mean. Methodology.

Published · Last updated