Published · Last updated
Air cargo
Air cargo: flat volumes, rising yields, and a supply of gateway land that cannot respond
IATA forecasts 2026 air cargo volume at 71.7 million tonnes, up just 0.2%, while cargo yield rises 6.5% — the first increase after three consecutive annual declines — and cargo revenue reaches $162 billion, up 7.2%. Volumes are flat because policy removed low-value e-commerce from the network. Yields are up because capacity cannot grow. For airport-adjacent landowners that combination is close to ideal.
Key takeaways
- Capacity growth has run below demand growth every month since March 2026. April 2026 available cargo tonne-kilometres were actually negative at minus 0.4% while demand grew 4.0%. Load factors are up one to two percentage points year on year every month.
- Rates are holding through what is normally the low season. The Baltic Air Freight Index global composite was unchanged over the four weeks to 31 August 2026 and up 18.1% year on year, with Hong Kong outbound up 20.5% and Chicago outbound up 30.9%. WorldACD put the August global average spot rate at $3.36 per kilogram, up 28% year on year.
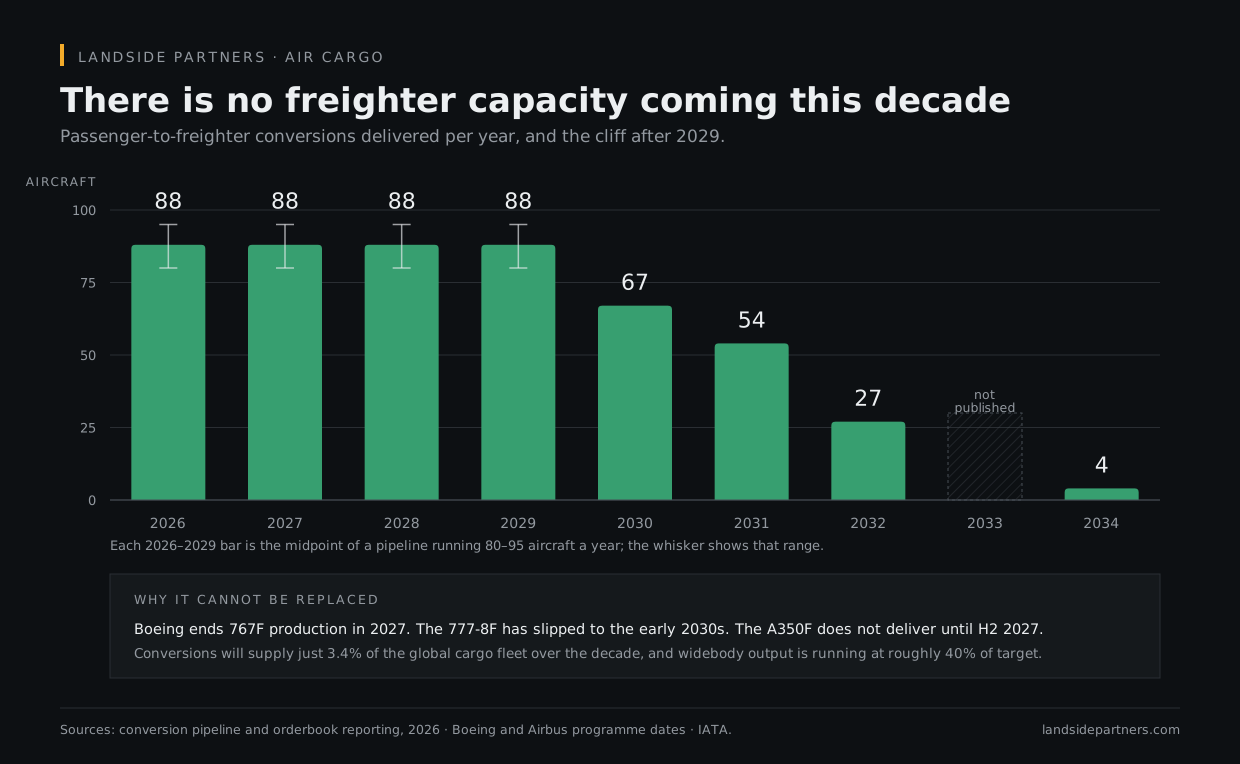
- Capacity cannot rise materially before the 2030s. The Boeing 777-8F has slipped to the early 2030s with 81 firm orders. Boeing 767F production ends in 2027. The Airbus A350F has 115 firm orders with first delivery in the second half of 2027. The passenger-to-freighter conversion pipeline falls from 80 to 95 units a year through 2029 to 67 in 2030, 54 in 2031, 27 in 2032 and 4 in 2034, contributing only 3.4% of the global cargo fleet over the decade. Widebody production is running at roughly 40% of target: Airbus wants 11 A350s a month by 2027 and is building 5; Boeing wants 5 widebodies a month and is building 2.
- Two rounds of policy removed e-commerce from the air network. United States de minimis repeal took out what had been 55% of China to United States air trade volume, 1.2 million tonnes, and immediately cut Asia to North America freighter capacity 40% in the first week of May 2025. The European Union's 3 euro flat charge on sub-150 euro parcels from 1 July 2026, against 4.6 billion such parcels entering the EU in 2024 of which over 90% came from China, has already cut low-value European air imports 33% year on year and Hong Kong to Europe tonnage 30%.
- AI hardware replaced it at higher value. United States hi-tech air imports rose 70% to 401,000 tonnes in the first quarter of 2026 while e-commerce air fell 11%. Data center cargo rose 42%, GPUs and AI accelerators 65%, and networking equipment 70%. AI hardware is now estimated at roughly 10% of global air cargo volume.
A quarterly brief on powered land, port capacity and air-cargo gateways, plus the Powered Land and Gateway Pricing Benchmarks data file.
- Dollar per megawatt and dollar per acre benchmarks by market, with the substation-distance and voltage premiums applied
- Every committed United States port capacity opening from 2026 through 2035, with cost, TEU and date
- Airport-adjacent rent premiums by gateway, and the constraint map that drives them
- The named project pipeline: site, megawatts, developer, power source, status
- Sources and periods for every cell. Nothing unattributed.
Capacity cannot rise materially before the 2030s
| Year | Aircraft |
|---|---|
| 2026–2029 | 80–95 a year |
| 2030 | 67 |
| 2031 | 54 |
| 2032 | 27 |
| 2033 | not published |
| 2034 | 4 |
The real estate consequence, stated plainly
| Market | Metric | Value |
|---|---|---|
| JFK cargo submarket | Asking rent, year-end 2025 | $30.08 per square foot NNN, an all-time high |
| JFK cargo submarket | Vacancy | 6.4%, against 8.8% for New York City industrial overall |
| JFK cargo submarket | 2025 leasing | About 770,000 square feet, up 63.4% year on year |
| JFK cargo submarket | Submarket size | About 7 million square feet across South Jamaica, Springfield Gardens and Inwood |
| JFK cargo submarket | New construction underway | None |
| LAX | Airport-adjacent rent | $21.80 per square foot, 24% above the broader Los Angeles market |
| Miami | Airport-adjacent premium | 12% |
| Dallas-Fort Worth | Starting rent growth 2019 to 2024, within five miles versus the wider market | Plus 107% against plus 64% |
| Chicago O'Hare | Same measure | Plus 66% against plus 47% |
The reallocation nobody can reverse
Memphis fell from third to sixth in the world in 2025, down 20.9% to 2,969,502 tonnes, on the loss of the United States Postal Service air cargo contract to UPS. Louisville grew 13.5% to 3,396,437 tonnes in the same year. A DePaul University study of January and February flight data found Louisville handling 202 flights a day, 37 more than FedEx Memphis, with 25.4% more tonnage capacity and 25.0% more volume capacity on peak days. Worldport is now the world’s largest express air hub.
Layered on top, FedEx’s Network 2.0 will close more than 475 stations by the end of 2027, roughly 30% of its facility footprint, with more than 200 already closed as of February 2026, targeting $2 billion of savings. FedEx air network flights are down 19.3% since mid-September, primarily afternoon operations. No disposition strategy has been disclosed, but 475 closures at typical station sizes is a material second-generation supply event in infill logistics submarkets over 2026 and 2027, hitting smaller markets first.
Amazon Air is rebalancing away from its own superhub, running more than 100 aircraft and more than 250 daily flights, with ten A330-300 freighters and eight additional 737 freighters under a Sun Country agreement extended to 2030, reduced activity at Cincinnati, expansion in Southern California, Texas and the Eastern Seaboard, and operations ceased at five United States airports since 2023. It now carries third-party dangerous goods, pharmaceuticals and perishables — a direct competitive entry into the verticals that justify specialized on-airport space.
Top twenty cargo airports in 2025
| Rank | Airport | 2025 tonnes | Year on year | Versus 2019 |
|---|---|---|---|---|
| 1 | Hong Kong HKG | 5,066,345 | plus 2.7% | plus 5.3% |
| 2 | Shanghai Pudong PVG | 4,091,941 | plus 8.3% | plus 12.6% |
| 3 | Anchorage ANC | 3,854,614 | plus 4.2% | plus 40.4% |
| 4 | Louisville SDF | 3,396,437 | plus 13.5% | plus 21.7% |
| 5 | Miami MIA | 3,128,165 | plus 13.6% | plus 49.5% |
| 6 | Memphis MEM | 2,969,502 | minus 20.9% | minus 31.3% |
| 7 | Incheon ICN | 2,954,684 | plus 0.3% | plus 6.9% |
| 8 | Doha DOH | 2,614,214 | minus 0.1% | plus 18.0% |
| 9 | Taipei TPE | 2,499,899 | plus 10.1% | plus 14.6% |
| 10 | Guangzhou CAN | 2,439,248 | plus 2.4% | plus 27.0% |
| 11 | Dubai DXB | 2,146,173 | minus 1.4% | minus 14.7% |
| 12 | Chicago ORD | 2,125,628 | plus 2.5% | plus 20.9% |
| 13 | Tokyo Narita NRT | 2,097,966 | plus 4.7% | minus 0.3% |
| 14 | Singapore SIN | 2,093,900 | plus 4.3% | plus 1.8% |
| 15 | Los Angeles LAX | 2,070,220 | minus 4.8% | minus 1.0% |
| 16 | Shenzhen SZX | 2,061,455 | plus 9.6% | plus 60.6% |
| 17 | Frankfurt FRA | 2,026,789 | plus 1.8% | minus 3.1% |
| 18 | Istanbul IST | 1,980,600 | minus 0.2% | plus 288.8% |
| 19 | Paris CDG | 1,939,526 | plus 1.3% | minus 7.7% |
| 20 | London Heathrow LHR | 1,591,964 | plus 0.8% | minus 4.8% |
Constraint creates diversion, and diversion creates land value
Amsterdam Schiphol is the clearest case. On 11 March 2026 the Dutch Council of State annulled the government’s 2025 amendment imposing a 478,000-flight annual cap, finding the decision had not been carefully prepared and lacked sufficient reasoning, but maintained a temporary restriction of no more than 27,000 commercial movements a year between 23:00 and 07:00, which is the provision that actually binds freighter operators. On 24 March 2026 the government said it would hold to the 478,000 cap regardless. Cargo had already been leaking to other airports.
Liege is the proven beneficiary, growing 14% in 2025 to 1.3 million tonnes — the fastest growth of Europe’s ten largest cargo airports — and 11.3% in the first half of 2026 to 697,816 tonnes, on the back of a 500 million euro CargoLand programme and a deliberate shift to daytime-capable operations, now 65.5% of movements against 41% in 2020.
In the United States the analogue is Rockford. RFD handled 1.5 million tonnes in 2025, up 9.5%, drawing O’Hare-overflow freighter traffic, and Hillwood started Rockford Logistics Park 20 Phase 1, 334,800 square feet one mile from the airport, in July 2026 for an April 2027 opening. Rockford is explicitly targeting data center and AI heavy-lift business for the Iowa, Illinois and Indiana region.
Heathrow has no relief before roughly 2036. The board approved third- runway planning funding in January 2026, with planning consent targeted for 2029 and first flights around 2036. Heathrow is the United Kingdom’s biggest port by value at over 200 billion pounds of cargo annually, and that capacity shortage sustains a scarcity premium on a fixed on-airport estate.
Where capacity is being added at scale the risk runs the other way. Dubai Al Maktoum’s roughly $35 billion programme targets an ultimate 12 million tonnes of cargo a year, more than double current world-leader Hong Kong, with 68 billion dirhams, about $18.5 billion, committed as of August 2026, 17,000 piles installed, 45 million cubic metres of earth moved, and phase-one completion in 2032.
No fee. One parcel. One page. Usually back within five business days.
A quarterly brief on powered land, port capacity and air-cargo gateways, plus the Powered Land and Gateway Pricing Benchmarks data file.
- Dollar per megawatt and dollar per acre benchmarks by market, with the substation-distance and voltage premiums applied
- Every committed United States port capacity opening from 2026 through 2035, with cost, TEU and date
- Airport-adjacent rent premiums by gateway, and the constraint map that drives them
- The named project pipeline: site, megawatts, developer, power source, status
- Sources and periods for every cell. Nothing unattributed.
This research was produced by Landside Partners, a commercial real estate research and advisory firm working with owners of industrial land across North America on data center, seaport and air-cargo demand. To have a specific parcel assessed, contact Brad Cohen at Landside Partners.
Related research
- Data Centers — Pillar: US data center demand, vacancy and the pipeline that has to find land, Q2 2026.
- Ports — Pillar: committed, funded and dated US gateway capacity and near-port industrial pricing, Q2 2026.
- Markets — Index of the twelve covered metros with each market's headline figure, Q2 2026.
- Research — Research hub: powered land, floating siting, ports and air cargo, published free in full.
- Powered Land Premium Calculator — Interactive calculator applying published Altus Group substation-distance and service-voltage premiums to market land bands, Q2 2026.
Published · Last updated